AI that generalises and stays calibrated.

We deploy time-series, language and tabular foundation models that generalise to cases they have never seen and stay calibrated, so each decision is defensible. They improve with every outcome and run wherever they fit, your cloud included.

↩ A person reads every brief and replies by email; we ask for your address next.

C^t=y^t+1∣t±q^1−αt σ^tαt+1=αt+γ (α−errt)\begin{align*} \hat C_t &= \hat y_{t+1\mid t} \pm \hat q_{1-\alpha_t}\,\hat\sigma_t \tag{1} \\ \alpha_{t+1} &= \alpha_t + \gamma\,(\alpha - \mathrm{err}_t) \tag{2} \end{align*}

Figure 1a. One-step-ahead forecasts of a simulated series. Each interval (1) is scored when its observation arrives; the level then updates by (2), adaptive conformal inference, so coverage holds near 1−α1-\alpha as volatility shifts. Rings mark misses.

ℓτ(u)=u (τ−1[u<0])q^τ=arg⁡min⁡q∈F∑iℓτ(yi−q(xi))\begin{align*} \ell_\tau(u) &= u\,\big(\tau - \mathbf{1}[u < 0]\big) \tag{1} \\ \hat q_\tau &= \arg\min_{q \in \mathcal{F}} \textstyle\sum_i \ell_\tau\big(y_i - q(x_i)\big) \tag{2} \end{align*}

Figure 1b. Simulated listings priced from area, rooms and distance by three gradient-boosted models, one per level τ∈{0.1,0.5,0.9}\tau \in \{0.1, 0.5, 0.9\}, each fitted by (2) with the pinball loss (1). Each sale is scored against its p10 to p90 bar before the model sees the price, so coverage measures how it generalises. Rings mark misses.

s(p)=∑r1/(κ+rankr(p))emit(c)  ⟺  ∃ p∈Pk:p⊨c\begin{align*} s(p) &= \textstyle\sum_r 1 \big/ \big(\kappa + \mathrm{rank}_r(p)\big) \tag{1} \\ \mathrm{emit}(c) &\iff \exists\, p \in P_k : p \models c \tag{2} \end{align*}

Figure 1c. An agent splits the question into sub-queries, runs dense and keyword search for each, fuses the rankings by (1) and reranks the best passages. Every claim in the answer cites a passage, and the gate (2) withholds any claim that no retrieved passage supports.

accept(y^)  ⟺  y^=fθ(x)∈Sy^(k+1)=fθ(x, err(y^(k))),k<K\begin{align*} \mathrm{accept}(\hat y) &\iff \hat y = f_\theta(x) \in \mathcal{S} \tag{1} \\ \hat y^{(k+1)} &= f_\theta\big(x,\ \mathrm{err}(\hat y^{(k)})\big), \quad k < K \tag{2} \end{align*}

Figure 1d. Documents move through a fixed pipeline. Each language-model output must fit the schema (1); a malformed one is retried with its error (2), and after KK retries it goes to a person. Only valid output reaches a tool, and every step is logged.

retrain  ⟺  e^t>τθ←θ′  ⟺  Lhold(θ′)≤Lhold(θ)\begin{align*} \text{retrain} &\iff \hat e_t > \tau \tag{1} \\ \theta &\leftarrow \theta' \iff L_{\text{hold}}(\theta') \le L_{\text{hold}}(\theta) \tag{2} \end{align*}

Figure 1e. A deployed model’s error on new data, week by week. When drift lifts it past the threshold (1), a challenger trains on recent outcomes and replaces the live model if it scores no worse on held-out data (2). Diamonds mark promotions, rings mark challengers that lost, and dashed lines show where each retired model was heading.

1,544 stocks valued / 1.6M legal passages indexed / 139,549 property listings collected / 79,268 legal documents with effectivity status / 28 macro indicators tracked / 14 of 17 forecasts beat the random walk / 11-year point-in-time backtest /

Any model can fit the past.
Ours must generalise,
and its ranges must hold.

Fitting the data you already have is the easy part. A model earns its keep on the cases it has not met: the next loan, the next month, the next contract. There it must also be calibrated: when it gives an 80% range, the outcome lands inside about 80% of the time. Every system we build says what it found and how far to trust it: a calibrated range on every forecast, a source behind every answer, a limit on every automated action.

That discipline comes from quantitative finance, and a bank’s model-risk team will recognise it: every model is tested on data it has not seen, compared with a simple baseline, and reported with its misses. We hold every AI system to that bar before it goes live, and again before every update.

Any market · any industry

Industries differ.
The methods generalise.

A lender, a grid operator and a hospital work with different data and different rules, and their decisions come down to the same four questions. Each question has a method that carries from one industry to the next and states how far to trust its answer. We fit that method to your data and your regulations.

Industry Q1 · ForecastWhat will happen? Q2 · ValuationWhat is it worth? Q3 · Cited answerWhat does the record say? Q4 · DecisionWhat should we do?
Banking & capital markets USD/VND and macro pathsvnpredict Listed equities, from public filingsvnvalue Securities and FX law, at clause levelvnadvise Which listed borrowers to review firstvnvalue
Insurance Claims frequency and reserves Insured property and vehicles Policy wording and exclusions Which claims go to a human
Energy & utilities Hourly load and spot price Generation assets and power contracts Grid codes and permits When to dispatch, when to maintain
Retail & consumer goods Demand by store and SKU Markdowns and price points Supplier contracts and labelling rules What to reorder, within budget
Manufacturing & logistics Lead times and freight volumes Equipment, fleet and inventory Standards, specifications and customs rules Production and routing plans
Healthcare & life sciences Admissions and bed occupancy Procedure and contract costs Clinical guidelines and formularies Which cases a clinician sees first
Real estate & infrastructure Rents and absorption Property, with a p10 to p90 bandvnappraise Real estate law, cited to the articlevnadvise Which sites to buy, hold or sell
Public sector & economics Macro indicators, 12 months outvnpredict Land and assets for taxation Tax and investment law in forcevnadvise Where to send inspectors first
Use case Forecasting & planning Valuation & pricing Document research Decision support
Table 1. Example decisions by industry and question. A marked cell names the public system where that kind of decision runs today, on Vietnam’s data; every other cell shows a decision of the same shape in another industry.

Platform

Six components, from raw data
to a decision you can defend.

Each deployment uses only the components its decision needs, fitted to your data. Every card names the public system where that component runs today.

01

Forecasting engine

Forecast demand, prices, load or cash flow, with a range on every number. Five open-weight time-series foundation models (TimesFM 2.5, Chronos-2, TiRex, Moirai, Toto) run behind one service and can be fine-tuned on your history; each forecast carries an 80% interval and a grade against a random walk.

  • zero-shot forecasting
  • probabilistic forecasts
  • MASE vs. random walk
Running invnpredict
02

Valuation engine

Put a value on every asset, loan or property that a committee can audit. Each figure comes from a published formula, or from a model that returns a p10 to p90 band, recalibrated on fresh data and checked for coverage before release.

  • quantile regression
  • interval calibration
  • discounted cash flow
Running invnvalue · vnappraise
03

Search & citation engine

Answer questions from your contracts, policies and regulations, each claim cited to the passage behind it. Semantic and keyword search with reranking find the passage, each source’s status is checked at query time, and an open-weight model can write the answer in the browser.

  • dense + sparse retrieval
  • reciprocal-rank fusion
  • attributed generation
Running invnadvise
04

Automation pipelines

Automate document intake, extraction and analysis, with every step checked. Each language-model step runs inside a fixed pipeline and returns structured output that the pipeline checks, so a malformed output stops the run before it reaches a user.

  • entity resolution
  • tool-augmented LLMs
  • schema validation
LLM steps inall four systems
05

Testing & grading

Know a model generalises before you rely on it. Every model is graded on data it has not seen, against a stated baseline: a random walk for a forecast, a forward holdout for a price, a point-in-time backtest for a valuation, recall and faithfulness tests for an answer.

  • out-of-sample evaluation
  • point-in-time backtests
  • faithfulness metrics
06

Deployment & learning loop

Run it in your data centre or your VPC, in the region you choose, and close the loop: outcomes flow back on a stated cycle, the model retrains when its error rises, and an update goes live only if it scores no worse than the current one on the same test, so the model keeps generalising as your data shifts. Freshness and drift monitors, packaged in containers.

  • distribution-shift monitoring
  • continual learning
  • reproducible containers
Deployed inall four · Retrains invnappraise

Selected Work

Four systems on Vietnam’s data,
open to anyone.

Three run as live products and one as a research preview, across Vietnam’s equities, law, property, and macro data. Each states its refresh cycle on its own site. Try any of them before you talk to us.

Figures read from each product’s site on 1 October 2026, and from vnpredict on 15 October 2026.

vnvalue.tech/en
vnvalue landing page: the headline “Sector-specific intrinsic value for every stock in Vietnam”, four figures (9 sector models, 150+ ratios per stock, an 11-year backtest, 1,544 names valued) and a histogram of market price against intrinsic value.
Plate 1. vnvalue.tech, English landing page, 1 October 2026.
01 Equity valuation Live

vnvalue

Sector-specific intrinsic value for every listed stock in Vietnam.

Nine sector-specific models value every listed stock, each figure reproducible from a published formula on public filings. A frontier reasoning model stress-tests every revision of the method, and the 11-year track record publishes the years the model was wrong.

MethodFrontier-model stress-testing · 9 sector models · CAPM / WACC · forensic accounting screen · owner graph with entity resolution

  • 1,544stocks valued
  • 9sector models
  • 11 yrpoint-in-time backtest
  • Reasoning-model critique
  • Discounted cash flow
  • Forensic accounting
  • Entity resolution
  • Point-in-time backtesting
vnadvise.tech
vnadvise landing page in Vietnamese: the headline “Pháp luật Việt Nam, tra cứu được kiểm chứng” over an illustration of a library reading room, two buttons, and three counts: indexed passages, documents with a known effectivity status, and 7 ready-made scenario guides.
Plate 2. vnadvise.tech, 1 October 2026. The interface is in Vietnamese.
02 Legal research · RAG Live

vnadvise

Vietnamese law at article and clause level, each claim cited to the passage behind it.

Ask a question on Vietnamese law and each claim in the answer cites its passage, with the document number and, where it is known, whether the document is still in force. Search splits each question into sub-queries on semantic and keyword search and prefers documents in force, though documents no longer in force can still appear. A Local mode writes answers in the browser (Qwen 3.5 0.8B); questions still go to the server for document lookup.

MethodSub-query decomposition · semantic + keyword retrieval · merge and rerank · effectivity status joined at query time · cited generation

  • 1.6Mpassages indexed
  • 79,268documents with effectivity status
  • 5legal domains
  • Hybrid retrieval
  • Query decomposition
  • Reranking
  • Attributed generation
  • On-device inference
vnappraise.tech
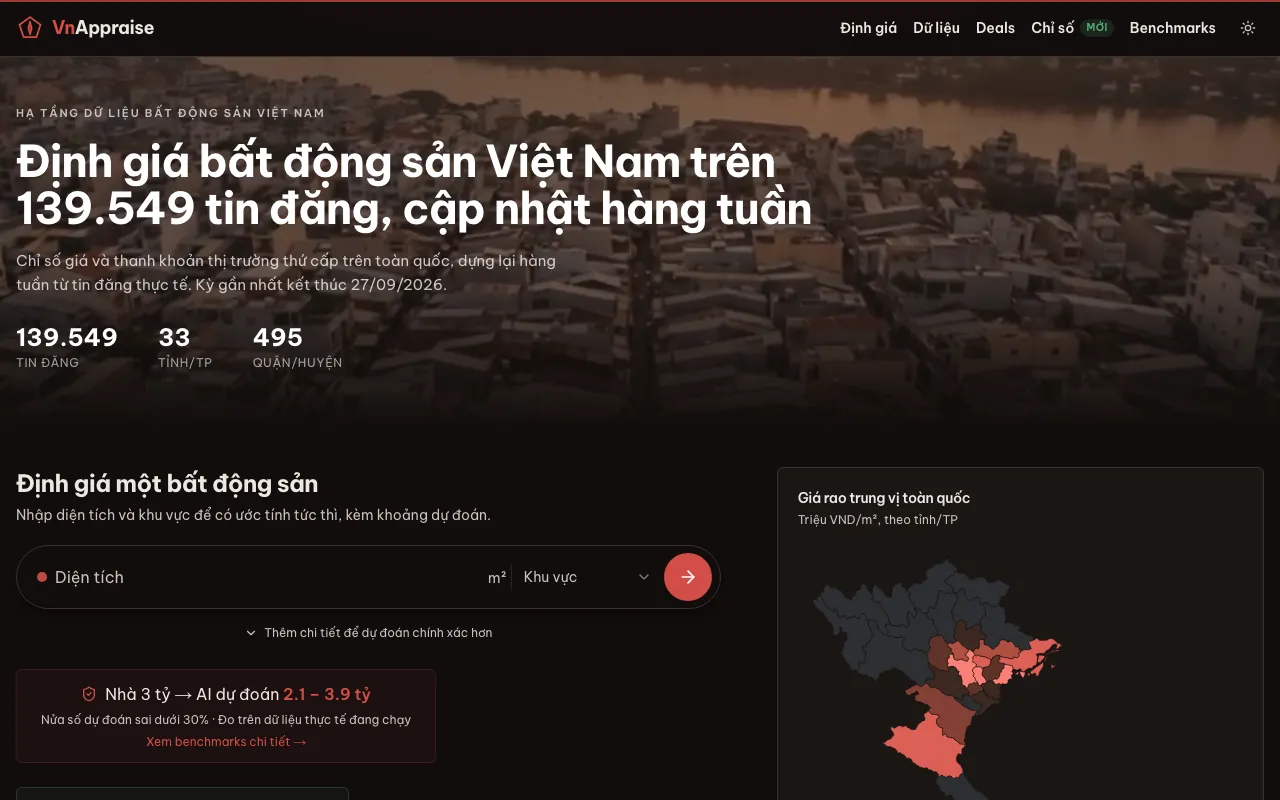
vnappraise landing page in Vietnamese, dark theme: the headline on 139,549 listings updated weekly, coverage of 33 provinces and 495 districts, the valuation form, and a province map of median asking price per square metre.
Plate 3. vnappraise.tech, 1 October 2026, in its default dark theme.
03 Property valuation · market index Research preview

vnappraise

A weekly price and liquidity index for Vietnam’s property market, beside a valuation model that publishes its own error.

A nationwide price and liquidity index, rebuilt each week from active listings, beside a three-quantile CatBoost model that returns a p10 to p90 band. Its median error is 22.6%, measured out of sample against asking prices over the trailing 7 days (the model uses no sale-price data). The site published a 15% bar for bank collateral in advance, and the model has not met it yet.

MethodThree-quantile gradient boosting · tabular foundation model benchmarks · automated hyperparameter search · drift-triggered retraining behind a champion/challenger gate

  • 139,549listings collected
  • 495districts covered
  • 22.6%median error vs asking price, out of sample
  • Quantile regression
  • Gradient-boosted trees
  • Tabular foundation models
  • Hyperparameter optimisation
  • Out-of-sample validation
vnpredict.tech
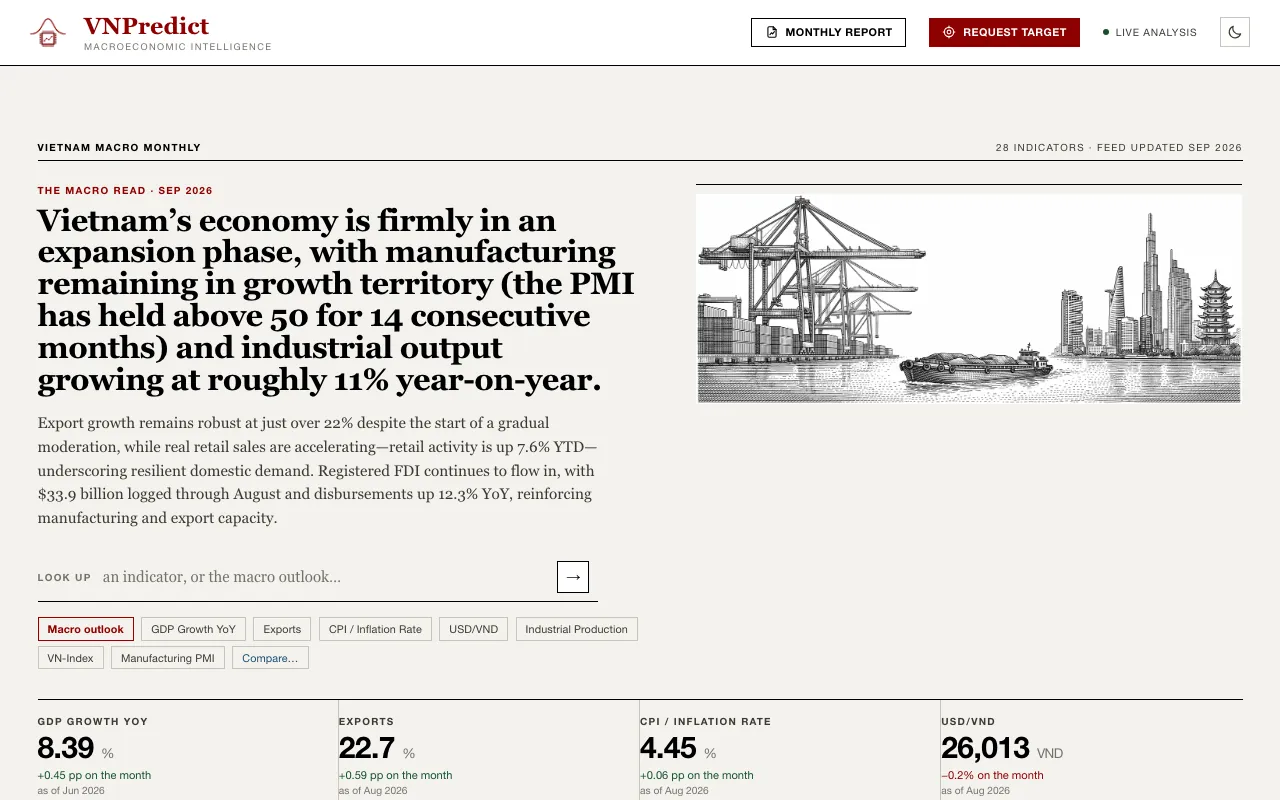
vnpredict landing page: the Vietnam Macro Monthly masthead for 28 indicators, a written macro read for September 2026, an engraving of a container port, and headline figures for GDP growth, exports, inflation and USD/VND.
Plate 4. vnpredict.tech, 1 October 2026.
04 Macroeconomic forecasting Live

vnpredict

Vietnam’s economy, month by month: 28 indicators tracked, 17 forecast and graded against a random walk.

Of 28 indicators tracked, 17 carry a 12-month forecast. Fourteen blend a local AR(1) model with the Chronos-2 foundation model, two use Chronos-2 alone, and USD/VND uses a robust-drift estimator (a Huber M-estimator) with a conformally calibrated band. Each forecast is graded good, moderate, or poor over 8 to 12 rolling-origin cross-validation windows against a horizon-matched random walk.

MethodAR(1) and Chronos-2 blend · Chronos-2 foundation model · Huber robust-drift estimator and conformal band for USD/VND · rolling-origin cross-validation · web-search commentary

  • 28indicators tracked
  • 14 / 17forecasts beat the random walk
  • 0.88MASE on USD/VND
  • Time-series foundation models
  • Conformal prediction
  • Huber M-estimation
  • Rolling-origin cross-validation
  • Search-grounded commentary

How we engage

From your data to a model that
improves with every outcome.

  1. 01

    Scope

    A short discovery on your data names one decision, the metric that judges it, the baseline to beat, and the scope. “Shipped” has a definition before any work starts.

  2. 02

    Build & prove

    Our engineers connect your data to the components the problem needs, train on it, and grade the result against that baseline on data it has never seen. You see the back-tests, calibration, and held-out evaluations first; if it doesn’t beat the baseline, it doesn’t ship.

  3. 03

    Deploy & run

    We deploy where you choose: your data centre, your VPC in any region, on-device, or our cloud. Then we run and monitor it, or hand it over, documented, to your team.

  4. 04

    Learn from every outcome

    Each output is scored against what actually happened, on the metric from step 01, and kept as the system’s memory. When the error rises, the model retrains on those outcomes. The new version goes live only if it scores no worse than the current one on the same held-out data; otherwise the current one stays.

    Back to 02, every cycle
Deploys to
  • On-prem
  • Your VPC
  • On-device
  • Our cloud

You choose where it runs. The models we train for you are yours.

Priced as a fixed deployment fee, then an annual platform licence with usage. We do not bill open-ended hours.

Four commitments, each kept by a live system.

α

Models that generalise

Every model is graded on data it has not seen, against a naive baseline, and the grade is published with its misses. On vnpredict, 14 of 17 forecasts beat a random walk, and the other 3 carry their grades on the same page.

∂

Uncertainty that is calibrated

A range is only useful if it is calibrated, so we measure coverage on data the model has not seen and publish it: vnappraise’s 80% band held 77.2% of out-of-sample asking prices in its latest 7-day window. Each result also traces back to a formula, a cited passage or a named model input, so a decision built on it can be defended.

∞

Models that keep getting better

Every output is scored against what actually happened, and an update goes live only if it scores no worse than the current one. vnappraise runs this loop daily on listings it has not seen, and retrains when its error rises. On vnpredict, a blend that beat the foundation model on the same tests went live on 8 October, and the forecasts that beat a random walk rose from 12 to 14 of 17.

∀

Deployed wherever it fits

Your data centre, your VPC in any region, the user’s device or our cloud: each model runs where your data is allowed to live, and the models we train for you are yours. vnadvise already writes answers on the user’s device in its Local mode, and looks documents up on its server.

“We suppose, but are never able to prove, that there must be a resemblance betwixt those objects, of which we have had experience, and those which lie beyond the reach of our discovery.”
David Hume, A Treatise of Human Nature, 1739

Every model rests on that supposition: the cases it has not seen will resemble the ones it learned from. A model that holds up on those cases generalises, and we named the company for it. We model what we don’t know. That is the whole job: turn the unknown into a distribution, the distribution into a decision, and the decision into something that runs in production.

Generalise Technologies is a founder-led AI company. We built the four systems above end to end, across data engineering, modelling, evaluation, and shipped product, on the data of one of the world’s fastest-growing economies. Now we bring that engineering to enterprises in any market and any industry: AI fitted to your data, kept in your jurisdiction, and explicit about how far to trust it.

Contact

Bring one decision and the data behind it.

We name the metric that judges it and the baseline it must beat, fit the models to your data, show you on held-out data that they generalise and stay calibrated, and deploy them wherever they fit.

Prefer email? hello@generalise.tech